 I got vacations last Friday and decided to have fun with parallel computing & networking.
Introduction
I wrote a framework that I called "PegasusHPC is a High Performance Crawler", which is a web spider aimed at allowing high performance and scalability. I chose the image on the left as a tribute to pinkie pie, who found critical & amusing bugs in the chromium project.
I think this framework will be useful for me and potentially to other people, since this kind of tools happen to be useful for security testing purposes and other web related ones. It's been open source released and you can find both the first beta release and the code in its web site.
Implementation
To achieve the previous goal, I implemented in PegasusHPC a producer-consumer paradigm, linked blocking queues, hashsets and a master-worker approach in java to allow a natural massive parallelization of the problem.
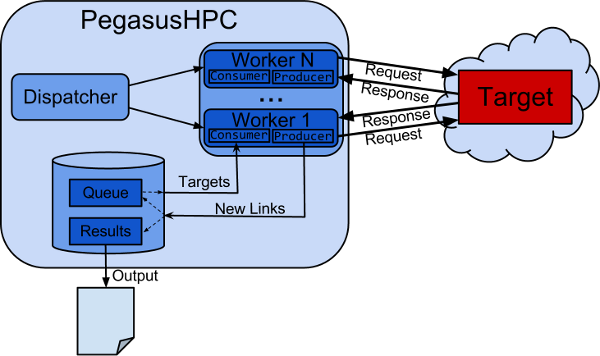
Figure 1. PegasusHPC Architecture Diagram.
In this approach, the Dispatcher is in charge of creating, handling and stopping the workers. On the other hand, each worker is executed in a different thread to minimize networking I/O idle time. Its implementation has been released with GPLv3 license and can the con can be found in its codebase.

Figure 2. PegasusHPC User Interface.
In Figure 2 we show its user interface, the current supported options are:
-
-t {target} Complete URI of the targeted host i.e. http://google.com
-nt {#threads} Number of threads to create. Suggested between 500-10000.
-max {#URIs} Number of unique URIs to crawl.
-ipBased to follow links to different domain of the same server.
-domainBased to target a specific host or path
-h print the help menu
Experimentation Results
In order to benchmarking the scalability of PegasusHPC, we carried out some experiments. The environment was the following one:- Machine: Laptop i7 8GB ram.
- Bandwidth: 100mbps
- Target: http://microsoft.com
- Max URls: 50000
- #Worker Threads: 1024
As a result of the previous test, PegasusHPC wrote two files, the one with the results and a log file with the trace as:
2 [main] INFO Target - protocol [http] host[microsoft.com] port[80] path[/]

4 [main] INFO Pegasus  - Targeting [http://microsoft.com/] with [1024]threads and stopping at[50000] results and targetting all subdomains

190 [main] INFO Dispatcher - [OK]Pool of 1024 threads successfully created, party started

192 [main] INFO Dispatcher - [OK]Current unique URIs[1] max urls[50000] idle threads [false] URIs queued [0].

4193 [main] INFO Dispatcher - [OK]Current unique URIs[15] max urls[50000] idle threads [false] URIs queued [0].

6194 [main] INFO Dispatcher - [OK]Current unique URIs[170] max urls[50000] idle threads [false] URIs queued [0].
...
193361 [main] INFO Dispatcher - [OK]Current unique URIs[50019] max urls[50000] idle threads [false] URIs queued [66012].

193361 [main] INFO Dispatcher - Results reached, stopping

193371 [main] INFO DataStats - took [193]secs

193372 [main] INFO DataStats - Analyzed [50019] unique pages

193373 [main] INFO DataStats - Found [116031] unique pages
I made a simple script to parse the previous log file and allow gnuplot to easily get the data.
cut -d ' ' -f2- log.out | grep Current |awk '{print $7 $9 $15}' | sed -e "s/URIs\\[//g" | sed -e "s/\\]urls\\[/ /g" |$sed -e "s/\\]\\[/ /g" | sed -e "s/\\].//g" > clean.res
The gnuplot script I developed for the graph is the following one:
set title "Target: http://microsoft.com/, Threads: 1024"
set terminal png
set output "plot.png"
set style data linespoints
set xlabel "Execution Time (seconds)"
set xrange [1:193]
set ylabel "Unique #URIs"
set yrange [1:80000]
set key left box
plot "clean.res" using 1 with linespoints ls 1 title "Analyzed URIs", "clean.res" using 3 with linespoints title "Queued URIs"
The chart that got generated as a result of the previous script running on the cleaned log file is shown in Figure 3.

Figure 3. PegasusHPC URIs Found per Second.
If we do a simple computation of the previous numbers, we got an average Analysis ratio of 259 URIs/second and an average unique URI finding ratio of 601 URIs/second, which is not bad for a not so powerful laptop machine. More experiments will be carried out soon.
No comments:
Post a Comment